[mashshare shares="true" align="left"]
Share on facebook
Share
Share on whatsapp
Share
Share on telegram
Share
(adsbygoogle = window.adsbygoogle || []).push({});

Mapletree Industrial Trust 3Q FY2025 Earnings: 10 Key Highlights, DPU Drivers, and Guidance Watchpoints

apletree Industrial Trust Earnings: 3Q FY2025/

Mapletree Industrial Trust (MIT) reported its 3Q FY2025/26 earnings with a 3.17-cent DPU, as revenue and NPI declined year-on-year due to divestment-related income absence, North America lease non-renewals, and FX headwinds. Below is an investor-focused earnings analysis covering the numbers that matter, what management is signaling on portfolio strategy, and the guidance watchpoints for MIT units.

MIT delivered DPU of 3.17 cents for 3Q FY2025/26, down 7.0% YoY and 0.3% QoQ.
A key nuance: the prior-year quarter included the tail end of divestment gain distribution, so MIT’s DPU excluding divestment gain comparison is more informative—down 3.9% YoY on a like-for-like basis.

Investor takeaway: headline YoY looks softer than underlying recurring earnings. The more relevant question is whether North America leasing stabilizes enough to prevent further DPU drift.

2) Revenue fell 8% YoY—mostly a portfolio mix story

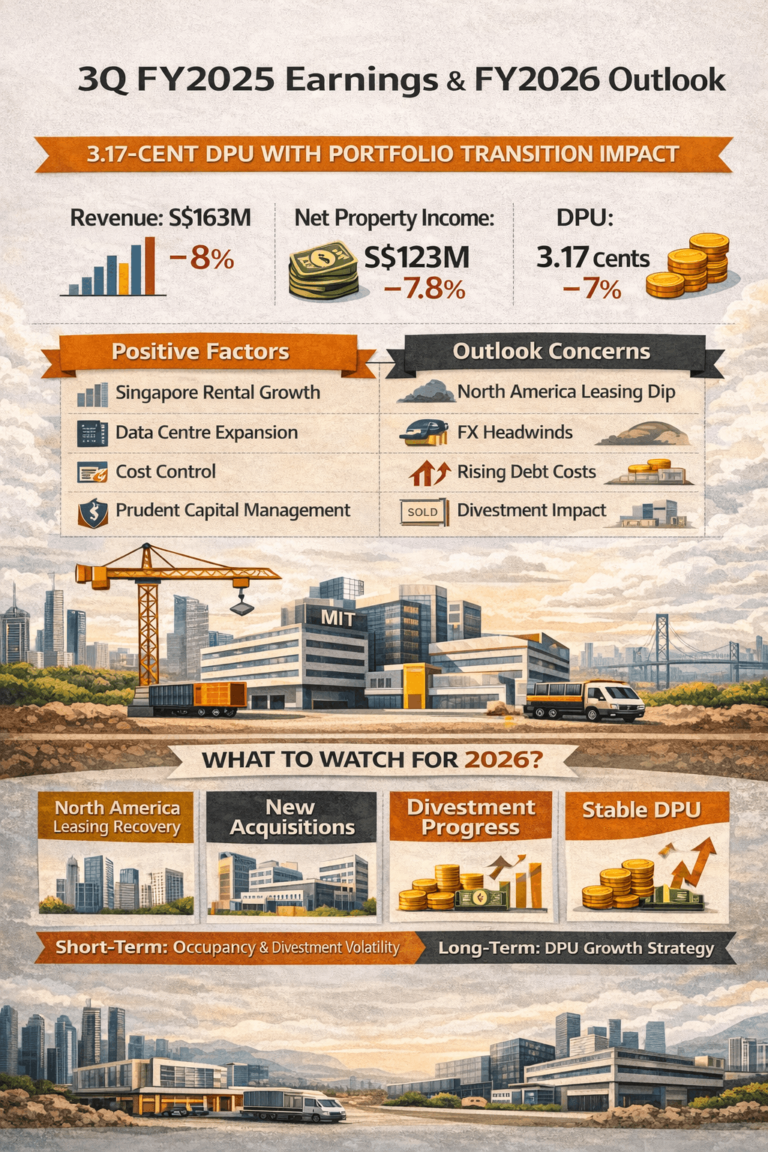
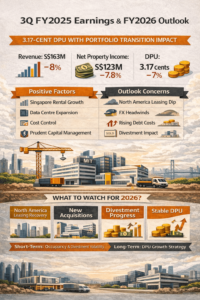
Gross revenue was S$163.1m (-8.0% YoY).

Management attributed the decline primarily to (i) absence of income from the Singapore Portfolio Divestment completed in Aug 2025, (ii) non-renewal of leases in North America, and (iii) USD depreciation vs SGD.

Investor takeaway: this is not simply “weaker demand”—it’s a combination of deliberate portfolio reshaping plus a near-term leasing gap in North America, amplified by FX translation.

3) NPI down 7.8% YoY, but margins held around the mid-70s

NPI came in at S$122.8m (-7.8% YoY).

Even with lower revenue, NPI margin remained broadly steady (roughly ~75%), helped by lower operating expenses after the Singapore divestment and lower utilities in the Singapore portfolio, partially offset by higher utility expenses in North America.

Investor takeaway: operating efficiency is not the core problem; the key driver is revenue pressure from portfolio changes and North America occupancy downtime.

4) Earnings per unit (EPU) dipped 4% YoY; profit held up better than DPU

MIT reported EPU of 3.14 cents (-4.0% YoY) and profit attributable to unitholders of S$89.7m (-3.5% YoY).
Because REIT distributions are tied to distributable income (not accounting profit), it’s common for DPU to move differently than EPU in any single quarter.

Investor takeaway: focus on “amount available for distribution” and its drivers (leasing, FX, interest cost) rather than accounting profit alone.

5) Segment mix shows Singapore industrial is the stabilizer

YTD through 31 Dec 2025, MIT’s Singapore General Industrial segment contributed S$131.9m NPI, while North America Data Centres contributed S$120.3m NPI.

This mix matters: Singapore industrial income tends to be steadier, while North America data centres can be higher growth but more sensitive to leasing timing, tenant concentration, and power/market dynamics.

Investor takeaway: MIT’s resilience thesis depends on Singapore and Japan providing a base while data centres drive longer-term growth.

(adsbygoogle = window.adsbygoogle || []).push({});

6) Leasing metrics: positive Singapore rental reversions offset by NA downtime risk

Management highlighted:

  • Overall portfolio occupancy: 91.4% (slightly up QoQ)

  • Singapore occupancy: 93.0% (up from 92.6%)

  • Singapore weighted average rental reversion: +7.1% (vs 6.2% prior quarter)
    For North America, weighted average lease expiry stayed at 6.2 years, and since Oct 2025 MIT executed 217,062 sq ft of leases (~3.0% of NA NLA) at +3.1% weighted average rental reversion, including a 13-year backfill lease at a previously vacant property.

    Investor takeaway: Singapore is performing as expected (positive reversions). The swing factor remains North America: how quickly MIT can backfill space and reduce downtime.

7) Interest costs are a watchpoint even as leverage improves

Average borrowing cost rose to 3.1% (from 3.0% in 2Q), driven by swap expiries repricing higher.

At the same time, leverage improved: aggregate leverage 37.2%, down from 40.1% at 31 Mar 2025.

Investor takeaway: balance sheet is healthier, but the cost of debt can still pressure distributable income. Watch the pace of hedging rollovers and refinancing.

8) Risk disclosure gives a clear view of rate sensitivity (often overlooked)

MIT’s financial statements include an interest coverage sensitivity: ICR is 3.9x base, 3.1x under +100 bps interest rates, and 3.6x under -10% EBITDA.

Investor takeaway: there is headroom, but higher-for-longer rates can compress coverage and potentially limit flexibility over time if leasing weakens.

9) Capital allocation points to continued data centre emphasis

YTD additions to investment properties were S$78.2m, with Data Centres (Asia) accounting for S$46.9m.

This aligns with management commentary that data centre demand (including AI workloads) remains structurally supported, even as power availability becomes a constraint in some markets (noted in MIT’s outlook commentary).

Investor takeaway: MIT is leaning into data centre growth, but execution (leasing, capex discipline, power constraints) is critical.

10) Guidance watch: divestments, portfolio rebalancing, and “transitional effects”

Management reiterated a North America divestment target of S$500m–S$600m, alongside selective divestments and acquisitions to strengthen portfolio quality.

Importantly, the CEO flagged that portfolio rebalancing may bring near-term transitional effects—temporary, but necessary for sustainable returns.

Investor takeaway: the core “earnings guidance” is qualitative—expect some near-term noise as MIT sells assets, manages downtime, and reinvests. For unitholders, the key is whether the reinvestment improves long-term DPU trajectory.

(adsbygoogle = window.adsbygoogle || []).push({});

Conclusion: What to watch next quarter

MIT’s 3Q FY2025/26 earnings show a REIT in the middle of portfolio transition: Singapore and Japan are delivering steadier occupancy and positive rental reversions, while North America leasing and FX remain the main swing factors. The balance sheet looks more flexible with leverage at 37.2%, but interest-rate repricing and leasing downtime can still pressure distributable income. For investors, the next milestones are :

(1) North America occupancy recovery and leasing spreads
(2) execution of the S$500m–S$600m divestment plan
(3) how reinvestment translates into recurring DPU growth.

Thank you for reading this post. If you enjoy this post, please share it with your friends or family members. Let’s get life transformed together! Many thanks.

Share on facebook
Share
Share on whatsapp
Share
Share on telegram
Share
(adsbygoogle = window.adsbygoogle || []).push({});

Leave a Reply

Your email address will not be published. Required fields are marked *

Trending Posts

Copyright 2021 © MR Life Changer | Powered by www.mrlifechanger.com

For business collaboration/enquiries, please contact: mr.life.changer9@gmail.com